Comparison with experimental results
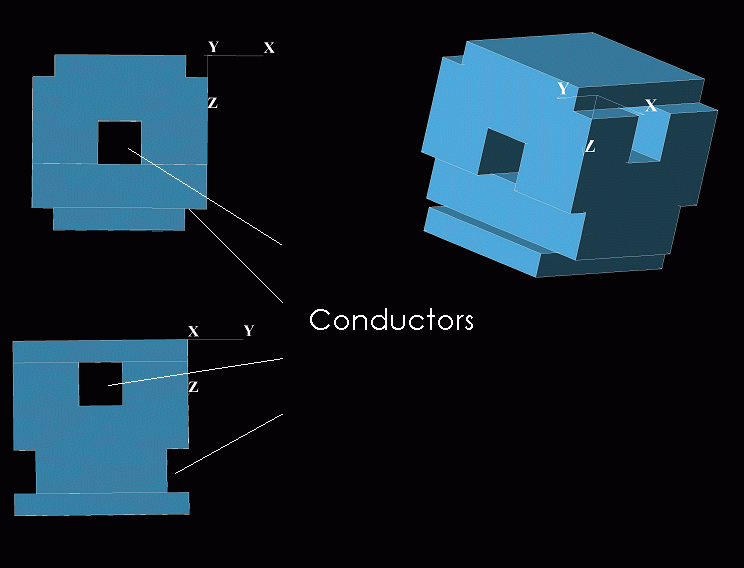
[Fleming], et al recently reported the results of an experiment on a 3d metallic crystal having a large infared bandgap at wavelengths greater than 8 micrometers. As a test of Curly3d, the modes of a similar crystal were computed. The unit cell of the crystal is shown below 
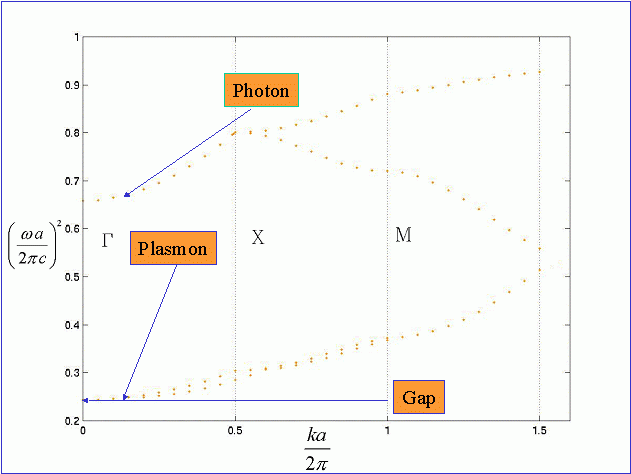
Notice how the conductors run in the x and y directions and intersect inside the cell. The dispersion relation for this structure as calculated by Curly3d follows 
The abscissa of this plot has three regions, in the
 region the k vector changes from
 to
to
 , the X region goes from
 to
to
 . Finally, the M region goes from
 to
to
 .
.
Curly3d found a bandgap at approximately 0.25, in good agreement with the experimental results which give
![\[ \left (\frac{\omega a}{2 \pi c}\right )^{2} = 0.28 \]](fleming_8.gif) . The crystal in the experiment was obviously not infinitely periodic and the conductors were not perfect conductors, two assumptions that Curly3d is forced to make. Despite this the prediction is within 15% of the experimental result. This result opens the door to more exploration of material configurations that will demonstrate an optical bandgap in a computational form to predict the results of an experiment, before the crystal is physically built.
. The crystal in the experiment was obviously not infinitely periodic and the conductors were not perfect conductors, two assumptions that Curly3d is forced to make. Despite this the prediction is within 15% of the experimental result. This result opens the door to more exploration of material configurations that will demonstrate an optical bandgap in a computational form to predict the results of an experiment, before the crystal is physically built.
Ryan McClarren
Last modified: Thu Aug 15 18:42:08 EDT 2002


 region the k vector changes from
 to
to
 , the X region goes from
 to
to
 . Finally, the M region goes from
 to
to
 .
. ![\[ \left (\frac{\omega a}{2 \pi c}\right )^{2} = 0.28 \]](fleming_8.gif) . The crystal in the experiment was obviously not infinitely periodic and the conductors were not perfect conductors, two assumptions that Curly3d is forced to make. Despite this the prediction is within 15% of the experimental result. This result opens the door to more exploration of material configurations that will demonstrate an optical bandgap in a computational form to predict the results of an experiment, before the crystal is physically built.
. The crystal in the experiment was obviously not infinitely periodic and the conductors were not perfect conductors, two assumptions that Curly3d is forced to make. Despite this the prediction is within 15% of the experimental result. This result opens the door to more exploration of material configurations that will demonstrate an optical bandgap in a computational form to predict the results of an experiment, before the crystal is physically built.